About Drafty
What is Drafty?
Drafty attempts to answer the question: “Just how drafty is it in that drafty room of the house?” A Raspberry Pi is installed in a poorly insulated enclosed porch and periodically takes readings of the ambient temperature, humidity, and light levels. For comparison with outdoor conditions, local weather data is retrieved from the National Weather Service.
About this site
The Drafty website is an interface for exploring the data that has been collected by the Raspberry Pi. The homepage (also called “Latest”) provides the most recently collected data, the History page provides a log of all data collected so far, and the Stats page provides some summary statistics calculated from the entire collection of data.
This site is built with Jekyll, and you can find the site’s full source code on GitHub.
About the data
Indoor data collection
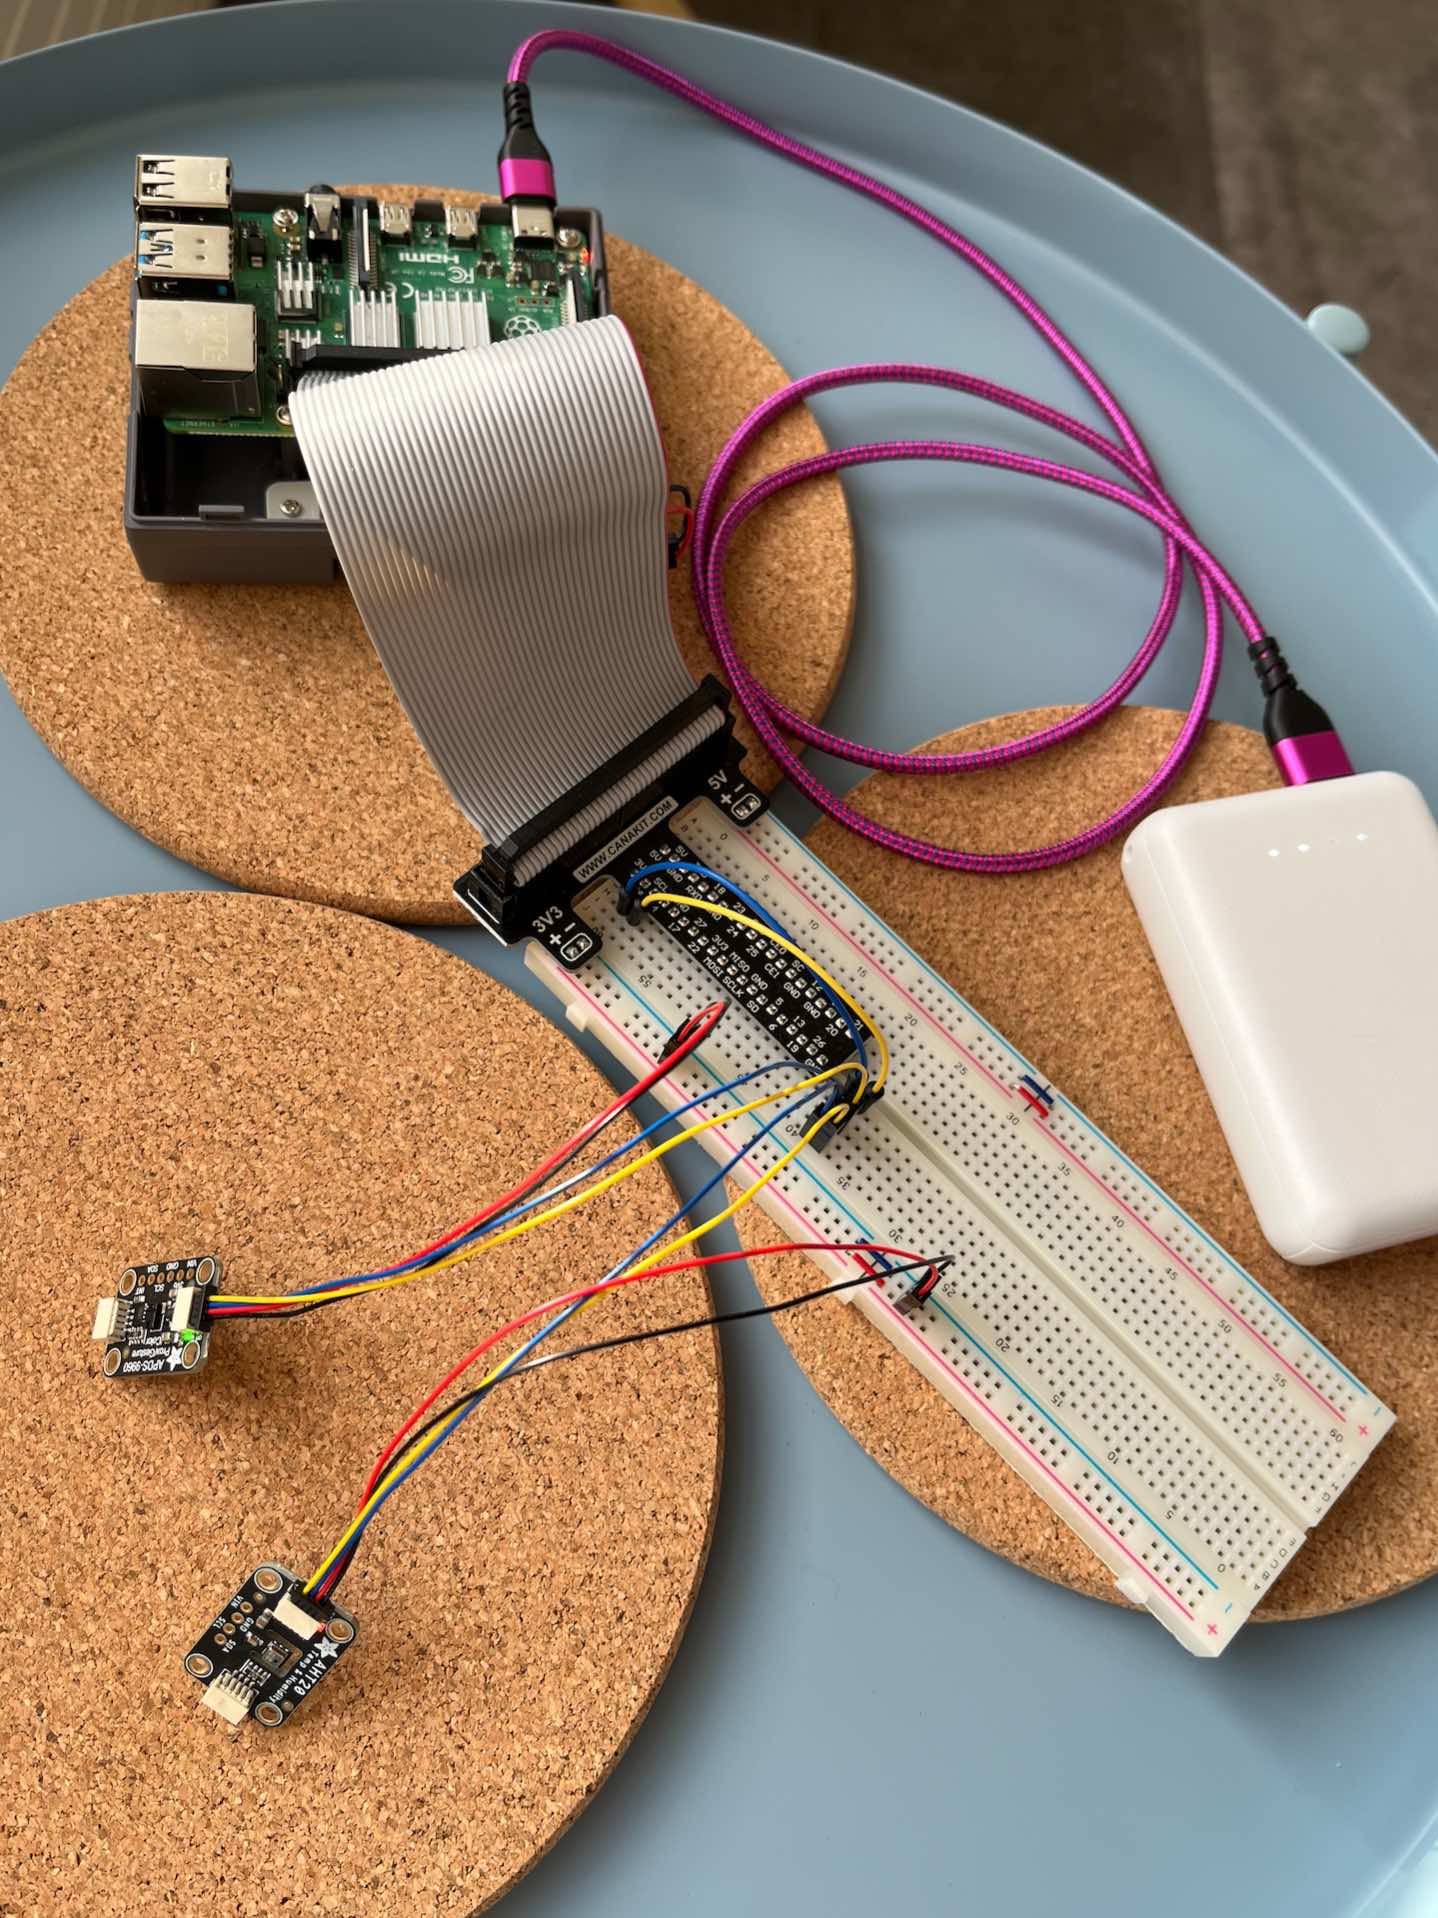
Indoor data is collected using the following hardware:
- Raspberry Pi 4
- Adafruit AHT20 Temperature & Humidity Sensor
- Adafruit APDS-9960 Light, Color, Proximity, and Gesture Sensor
and the following software:
- Adafruit AHTx0 CircuitPython Driver
- Adafruit APDS-9960 CircuitPython Driver
- Adafruit Blinka (provides support for the drivers by emulating CircuitPython API on machines that run CPython or MicroPython)
- drafty-data-collection (collects data from the sensors and stores it in CSV files)
Local weather
Local weather data is retrieved from the National Weather Service’s API Web Service.
Data format and contents
Data is stored in two CSV files:
most-recent.csvcontains the most recently collected data in comma-separated format.all.csvcontains a running log of all data in comma-separated format. Each row represents a separate reading and has an associated timestamp.
The following data is available, both in most-recent.csv and in all.csv:
| Property | Name in CSV header | Notes |
|---|---|---|
| Time | time | Date and time at which the corresponding data was collected, reported as an ISO-style datetime string |
| Air temperature, °C | temp_c | The AHT20 reports temperature in degrees Celsius |
| Air temperature, °F | temp_f | For convenience, the Celsius reading is converted to Fahrenheit |
| Humidity | humidity | The AHT20 reports relative humidity as a % |
| Ambient light | lux | Lux value is calculated (using adafruit_apds9960.colorutility) based on red/green/blue light levels reported by the APDS-9960 |
| Color temperature, °K | color_temp | The color temperature of the ambient light is reported in degrees Kelvin (similar to what you might find in the specs for a household lightbulb). Like lux, color temperature is calculated based on the red/green/blue values reported by the APDS-9960. |
| Red light | red | Red light value reported by the APDS-9960 |
| Green light | green | Green light value reported by the APDS-9960 |
| Blue light | blue | Blue light value reported by the APDS-9960 |
| Clear light | clear | Clear light value reported by the APDS-9960 |
| Outdoor temperature, °C | nws_temp_c | Local temperature as reported (in Celsius) by the nearest NWS station |
| Outdoor temperature, °F | nws_temp_f | For convenience, the local temperature is converted to Fahrenheit |
| Outdoor humidity | nws_humidity | Relative humidity (%) as reported by the nearest NWS station |
| Local weather conditions | nws_conditions | Summary of current weather conditions as reported by the nearest NWS station |
Limitations
Uptime
The ideal site for collecting temperature, humidity, and light data does not include access to an electrical outlet. Therefore, Drafty runs on battery power and must periodically be taken offline for recharging.
Data quality
The NWS API occasionally returns empty data. When this occurs, the value presented in the table is “n/a”.
In mid-February, Drafty began recording abnormally high temperatures, in the neighborhood of 90–105 F (while the outdoor temperature was in the low 40s to mid 50s). Since these readings occurred in the afternoon on sunny days, I suspect they are skewed due to increased direct sunlight and the changing angle of light as we move from winter toward summer in the northern hemisphere. (Drafty is located just below a south-facing window. As we move from the winter solstice toward the summer solstice, the sun is—relatively speaking—moving higher into the sky.) I’m not yet certain how, or indeed whether, I will compensate for this phenomenon.
Making Drafty your own
Want to build your own version of Drafty for that drafty room of your home? Follow these steps:
Setting up the Drafty data logger on your Raspberry Pi
- First, fork the drafty-data-collection repo and clone it to your Raspberry Pi. It contains the code that collects the data, which means it must be installed on your Raspberry Pi.
- Fork the drafty repo (this one!) and clone it to your Raspberry Pi. It contains the data files that drafty-data-collection will write to, so it must be installed on your Raspberry Pi. If you typically run your Pi headless (i.e., without a display or other peripherals attached), you will likely want to clone the drafty repo to another computer as well.
- Follow the instructions in the drafty-data-collection README. It will walk you through the hardware setup and software configuration you will need in order to run the data logger successfully.
Setting up your Drafty website
Once you have Drafty successfully collecting data, it’s time to check out the results!
- If this is your first time using Jekyll (either on this machine or ever), you will need to install both Ruby and Jekyll. Go to the Jekyll docs’ Installation page, select your operating system, and follow the instructions.
- From the command line, navigate to the drafty directory and run
bundle exec jekyll serve. Optionally, include the--livereloadflag if you want your site to automatically rebuild and reload whenever you save changes. - Open a browser and navigate to
localhost:4000/drafty/. You should see your Raspberry Pi’s latest readings! - If you want to make your Drafty website public, you can use GitHub Pages. The simplest way to do this is to configure your site to publish whenever changes are pushed to a particular branch. Follow these “Publishing from a branch” instructions in the GitHub docs.
- Customize the content, styles, and/or features of your Drafty site as much or as little as you want. Have fun!